Applying Filters to Study Adjacent “Neighborhoods”
Often we need to use information from the region around us to evaluate data. For example, standing in a Nebraska cornfield versus a valley in central Colorado, you might notice the difference in elevation characteristics of the “neighborhood” around you. The relief is the difference between the highest and lowest point. Can you do this in a GIS? Easy. Two ways.
- find the maximum elevation within a specified distance, then the minimum, and subtract the latter from the former.
- find the range of values within a specified distance.
These operations are known as “kernels” or “filters” or “focal statistics” in ArcGIS-speak (See the ArcGIS Pro help pages for the focal toolset)
- min & max
- mean & median
- sum & range – highest value minus lowest value in the neighborhood
- standard deviation, of values in the neighborhood
- majority – cell value encountered the most times in the neighborhood (also known as a “mode filter”)
- minority – cell value encountered the fewest times in the neighborhood
- variety – how many different types of cell values in the neighborhood (also known as “diversity” in other GIS uses)
Can you think of a use for each one?
Filter or neighborhood operations differ greatly depending on whether they operate on discrete or continuous data.
Open the project from . . . \demo\filter\
Here I use the “filter” tool to look at elevation, although I don’t think the default 3×3 is a good choice for topographic analyses (try 5, 7, 9 or more).

I don’t understand the output of the high-pass filter.
What size filter would you use to determine relief in the region around W&L, compared to that near Richmond?
Filtering Categorical Data
Which of the options are appropriate for categorical data?
Mean and Range should be replaced by Majority and Variety
A Majority filter has the effect of simplifying the map, eliminating smaller patches of isolated cells like grow/shrink operations.


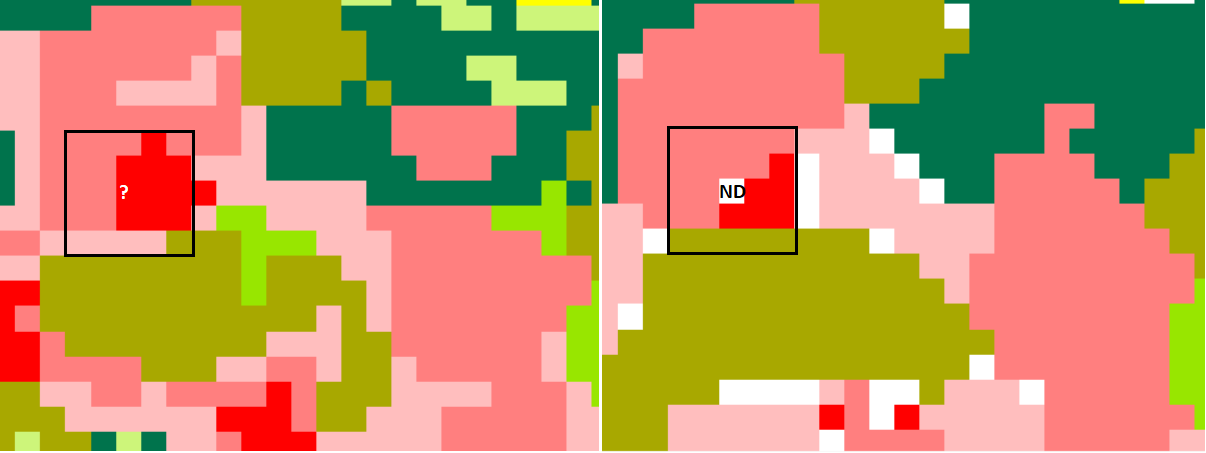
However, results can be unpredictable; in the NLCD data on the left, any place no majority arises becomes “NoData.” (10 pink=10 red). How could you “repair” this layer full of NoData holes?
Neighborhood Shape
most GIS tools allow you to choose a different size and shape of the neighborhood that you’re sampling (of grids or points)

Kernels
Irregular or nonuniform Filters or Kernels are also possible using the Focal Statistics tool.

These kernels are made in a text editor and consist of a first line with the width and height of the kernel, and the kernel values below. The irregular has just ones and zeros, but they can include any real number, like the weighted one above (What does that do?). Look at the kernel file \filter\demo_kernel.txt. How would that filter the DEM?
Block Analysis
This takes a similar approach to ratio and categorical neighborhood data, but the output is a degradation of the spatial variability. This is also possible with a resample analysis.

(from ESRI help files)