Profiles and Viewsheds
Given that we have digital topography, it is easy to examine a line across the topography and determine what is visible. The following is from demo\topo\ topo_data project and profiles and views map (starting with the dem_proile line, you have to use the”interpolate shape” geoprocessing tool to add the elevations of the DEM to the line, then you can plot it)
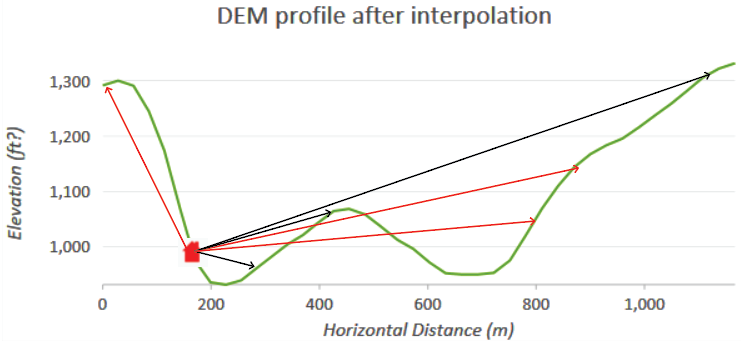
To complete this in a MAP VIEW to make a “viewshed,” we need to rotate analysis 360 degrees around a point or each of a series of points or lines. Below is that analysis for a house located at about 990 ft on the profile above.

For multiple locations or lines (like roadways) this analysis becomes significantly more complicated and CPU consuming.

In 2002, this analysis took about 5 minutes on our 1.5 km by 1.5 km grid (50 by 50 grid).
Can we add any more information?
— What part of visibility have we missed?
— Can we add any more data to this process?