Ratios
The ratio of two bands removes much of the effect of illumination in the analysis of spectral differences. This is possible because the composition differences between two geologic units (here limestone, which is “gray” in RGB321, and a “red bed” which is red in RGB321) determine the ratio of any two bands, whereas the illumination determines the magnitude of the DN received by the satellite..
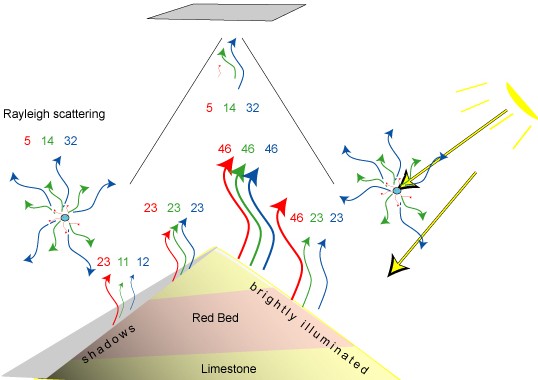
However, in areas with significant haze, the performance of ratios is much improved by removing in the haze produced by Rayleigh scattering in the atmosphere.
| with atmospheric haze (RGB 5 14 32) | ||||
| Illumination | lithology | TM band 3 | TM band 1 | Ratio 3:1 |
| Sunny side | limestone | 51 | 78 | 0.7 |
| Shadow side | limestone | 28 | 55 | 0.5 |
| Sunny side | red bed | 51 | 55 | 0.9 |
| Shadow side | red bed | 28 | 43 | 0.7 |
| with dark pixel subtraction (or minimum value subtraction) | ||||
| Illumination | lithology | TM band 3 | TM band 1 | Ratio 3:1 |
| Sunny side | limestone | 46 | 46 | 1.0 |
| Shadow side | limestone | 23 | 23 | 1.0 |
| Sunny side | red bed | 46 | 23 | 2.0 |
| Shadow side | red bed | 23 | 11 | 2.0 |
figure and table adapted from Sabins, 1978, Remote Sensing Principles and Interpretation.
Switch to the Egypt demo scene and display it as a “stretch” instead of RGB.
This single band (TM band 1, blue radiation) shows strong topography because of differences in illumination.
 S
S
(above: you sample Landsat 8 image from Egypt)
But the ratio red / green (B4 / B3) removes much of the effect of illumination and yield differences in rock type.

The two ratios displayed below show other characteristics of the rocks. SWIR 2 Band (7 in both Landsat 7 and 8) is good at showing hydroxyls (high absorbance) common in hydrothermally altered rock or clay and SWIR 1 (Landsat band 6) has high reflectance for iron oxides.
| SWIR1/green (Landsat 8 bands: B6 / B3) | SWIR2/NIR (Landsat 8 bands: B7 / B5) |
 |
 |
We can use all three of these ratios in an RGB image (3/2, 5/2, 7/4, RGB) simultaneously.

I didn’t choose this place in Egypt at random. It is called the Maetiq dome (a geologic description), has over 1000 m of relief (challenge illumination constraints) and was mapped using hand sample spectra and Landsat TM by Sultan et al. (1987), and results in “Sultan’s Formula” in ArcGIS Pro’s raster functions.

where the 5/1 = SWIR1/blue, 5/7 = SWIR1/SWIR2, 5/4×3/4 = SWIR1/NIRxRed/NIR
or in Landsat 8 (6/2, 6/7, 6/5×4/5). I don’t know what you’d put into the “input bands” for ArcGIS Pro. Try the ESRI help they get the citation and the geology mixed up….?”The resulting image highlights rock formations called ophiolites on coastlines.”?
Above image from
Sultan, M., Arvidson, R.E., Sturchio, N.C. and Guinness, E.A., 1987. Lithologic mapping in arid regions with Landsat thematic mapper data: Meatiq dome, Egypt. Geological Society of America Bulletin, 99(6), pp.748-762 (Google scholar)
which you have a PDF of in your demo/satellite_demo. This was a groundbreaking paper for remote sensing in geology.
Lastly a word of caution: Ratioing can mask the differences between pixels that have similar ratios of bands but different overall magnitudes of return. Therefore it is only one tool of several that can or should be applied.
More Ratios
Normalized Difference Vegetation Index (NDVI)
Used to map global primary production and is computed

where the very near infrared “VNIR” is TM band 4 or OLI (Landsat 8) band 5 (also know as “NIR”).
where increases in red show stressed vegetation and VNIR shows chlorophyll. Global surveys are available monthly at http://earthobservatory.nasa.gov or NOAA
The NDVI for the area near Lexington looks like this (for an early spring image).

ArcGIS pro has several other kinds of pre-set ratios mostly for vegetation

Other kinds of Normalizing…..
A “normalized burn ratio” for example (equation is better here, no band numbers), is used to calculate burn severity (Note the 2nd paragraph; DNs changed from 8 bit to 16 shifting from Landsat TM+ to OLI, so criteria will shift too). The following image from that the first link above shows a burn ratio from Landsat 7 data.
