Using a DEM we can define a watershed and the streams within it in a series of steps. If you want more detail on the hydrology tools in ArcGIS Prom, and the concepts they support, go to this help website and click through some of the topics.
Several steps need to be taken, in order, to complete a hydrological analysis of from a DEM dataset.
- Eliminating “pits” in the DEM
- Where are they? Undrained depressions prevent most watershed algorithms from working. Sinks are both natural, such as “sinkholes,” and artificial ones caused by errors in datasets.
- Want to remove them? Most GIS routines “fill” the sinks numerically such that computational “water” will drain across the sink to the next lowest point. Other GIS routine involve a combination of fill and breach, wherein the depression is filled and the cell in the steepest path downhill is abraded.
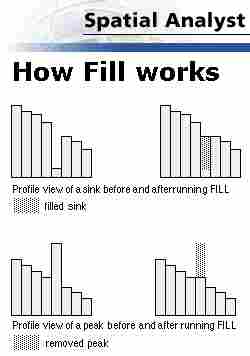
- ArcGIS’s approach: If you look up the process for ArcGIS is says that it does a combination of the two, but I don’t think the ArcGIS routine “remove peaks” as shown below. Filling tends to make stream profiles into stair steps. Using the tools in the Hydrology toolbox within the Spatial Analyst toolbox, you can execute a “fill pits” routine that iteratively calculates flow direction.
Here is an example of a river profile using raw DEM data containing pits (from Harbor et al., 2005 paper on my website). This “route” or stream path follows cell to cell the lowest downstream outflow from each cell to create a stream path, but it is full of errors.

- Determining flow direction (from original surface and/or “filled” DEM)
- From the ArcGIS help files
“The direction of flow is determined by finding the direction of steepest descent from each cell. This is calculated as drop = change in z value / distance * 100. The distance is determined between cell centers. Therefore if the cell size is 1, the distance between two orthogonal cells is 1 and the distance between two diagonal cells is 1.414214.”

- For flow direction, ArcGIS uses a binary sequence to label flow direction, using the “D-8 method” and EAST as the value 1, doubling in a clockwise direction.

(Why does the GIS store the flow direction as a binary sequence? Why is that fast for a computer?) - Pits are easily found with a flow direction map, because flow is “trapped” where two or more cells point at each other, as shown below.

- Does this approach work everywhere? How about for this common geological feature in death valley?

https://goo.gl/maps/9JdjTEhe6xAuSgPCA
There are several approaches to flow direction calculation in the literature. Some partition flow to only one cell, some divide it up based on the proportion of flow into each cell (usually 3 or less neighboring cells). - It is possible, using what is known as the “D-infinity” method developed by David Tarboton at Utah State, to partition the flow incrementally to many cells in the downslope direction. See the help fill on Flow Direction.
- From the ArcGIS help files
- Computing Flow Accumulation
- Accumulation is the total number of cells that drain into a given cell. The value of zero is given to the ridge lines, where flow originates. This determined from sequential analysis of flow direction. The following flow direction is constructed on the DEM with sinks (no “Fill” yet).

Note the “accumulation” in the sink. Any cell where flow originates (no flow into it) has a value of 0.
- Accumulation is the total number of cells that drain into a given cell. The value of zero is given to the ridge lines, where flow originates. This determined from sequential analysis of flow direction. The following flow direction is constructed on the DEM with sinks (no “Fill” yet).
- Determining streams and subwatersheds
- Our hydrology expert needs to decide a “threshold” value of accumulation required to create a stream; how much area is needed to create enough water to have a stream. Here this calculation is accomplished in one of two ways using the “raster calculator” tool.

- where SetNull( conditional statement, value if false) –if the conditional statement is true, the cell is set to “NoData” or “Null” (where NoData is actually a number you don’t expect to find in the data. See the properties box to find the NoData value)
or
or using the Con function: “Con(conditional statement, value if true, value if false).
If you omit the “value if false” and the conditional statement is false, the cell value is set to NoData or “Null” . - The “Basin” tool finds the watersheds draining to different end points in the DEM, the “Watershed” tool finds basins above selected points (help file)

- GIS operators can also define a “pour point” where the water leaves one or more watersheds and the GIS will define the watershed above each pour point.
- Our hydrology expert needs to decide a “threshold” value of accumulation required to create a stream; how much area is needed to create enough water to have a stream. Here this calculation is accomplished in one of two ways using the “raster calculator” tool.
Hydrologic modeling has important uses in
- flood warning (real-time rainfall estimates is derived from RADAR and delivered to a GIS-based watershed model).
- channel and navigation studies
- water quality modeling (nutrient loading to the Chesapeake Bay, for example)
- geomorphic study of erosion and uplift